
In 2023, the digital world witnessed one of the most significant transitions: Universal Analytics to GA4.
Google Analytics has been a popular choice for many digital marketers to collect and study data for their marketing efforts. With everybody so accustomed to universal analytics, transitioning into GA4 is still a rocky ride for many!
GA4 offers much fewer built-in reports than universal analytics, which has both its pros & cons.
Cons: You have to customize everything in order to get the data most suitable for you.
Pros: You get to customize everything in order to get the data most suitable for you!
What a play on words!
Here are some ways you can create basic custom reports!
Step-by-Step Guide to GA4 Report Customization
You can either start from an existing detail report or a new detail report. A detail report is a report that shows data for one or two dimensions. It can have up to two visualizations and a table.
Once you have a detailed report to customize, you will have the following customization options available.
1. Fine-tuning Metrics in GA4
Customizing metrics in Google Analytics 4 opens up new avenues for data visualization and analysis. To customize the metrics of any data report, you can click on the edit button given in the right-most corner of the report.

By clicking on the metrics tab, you get various options of metrics to Add or Remove. Once you’re done customizing, click on Apply, given at the bottom of the tab & you can either save the customization in the existing report or save a copy of it.
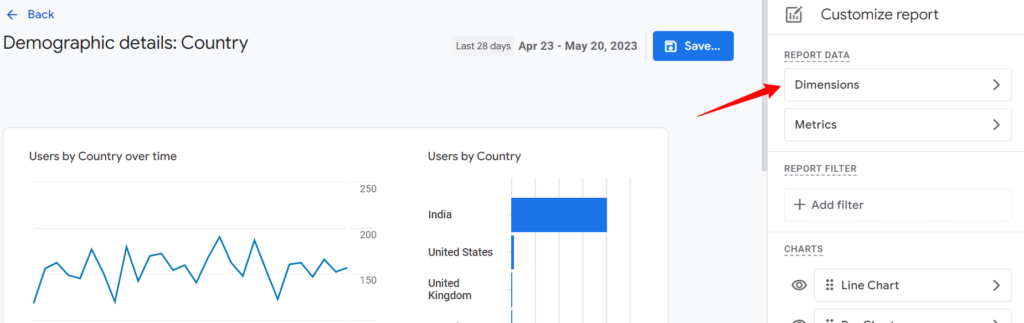
2. Adjusting Dimensions for Enhanced GA4 Insights
To include or exclude primary dimensions, simply click on the “Dimensions” button located in the Report Data section. The selected dimensions will appear as the first column in the report table. If you add multiple dimensions to this list, Google Analytics users can choose from them in the dropdown menu of the first column.
3. Personalizing Charts in Google Analytics 4
With GA4’s reporting capabilities, customizing charts and filters allows for a more tailored analytical approach. By default, in GA4, most data is represented through line & bar charts, which you can customize as per your requirement by the same tab from where we customized metrics & dimensions!
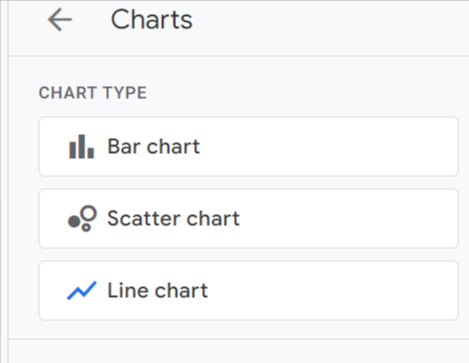
Other than changing the type of chart, you can also Hide & Reorder a chart by drag & drop.
4. Applying Focused Filters in GA4 Reports
By applying a filter to a custom report, you can ensure that anyone who accesses it sees a tailored view of the report data. For instance, you have the option to apply a filter that displays only website data while excluding data from mobile apps. While users with property access can temporarily remove a filter at the top of a report, Analytics will reinstate the filter once they exit the report.
If you need to completely hide certain data from specific users, such as city data, it is recommended to utilize sub-properties instead.
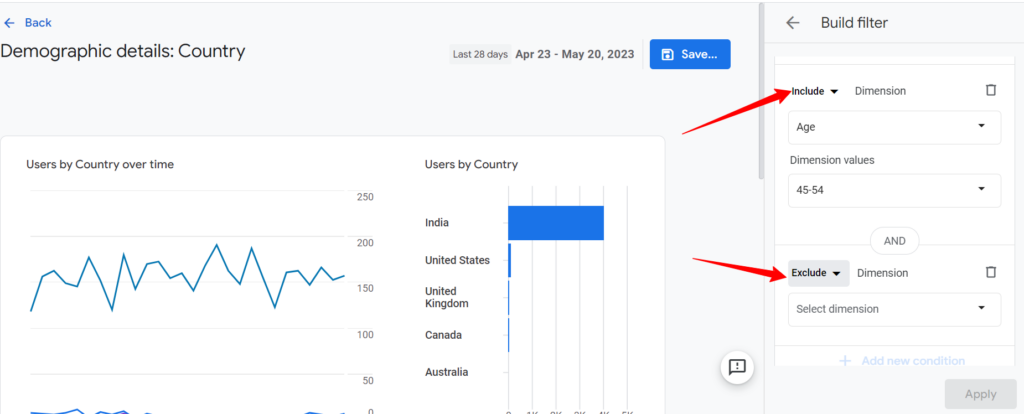
You can use conditions that include & exclude the data that you need to filter. For example: in the report shown above, we are showing the country-wide users who are aged between 45 and 55.
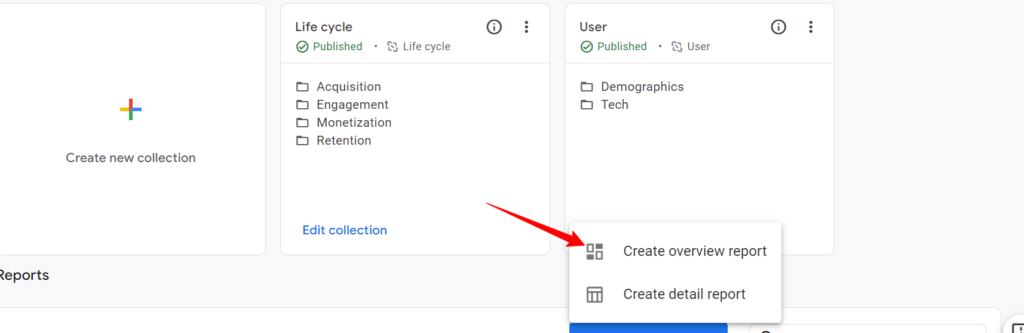
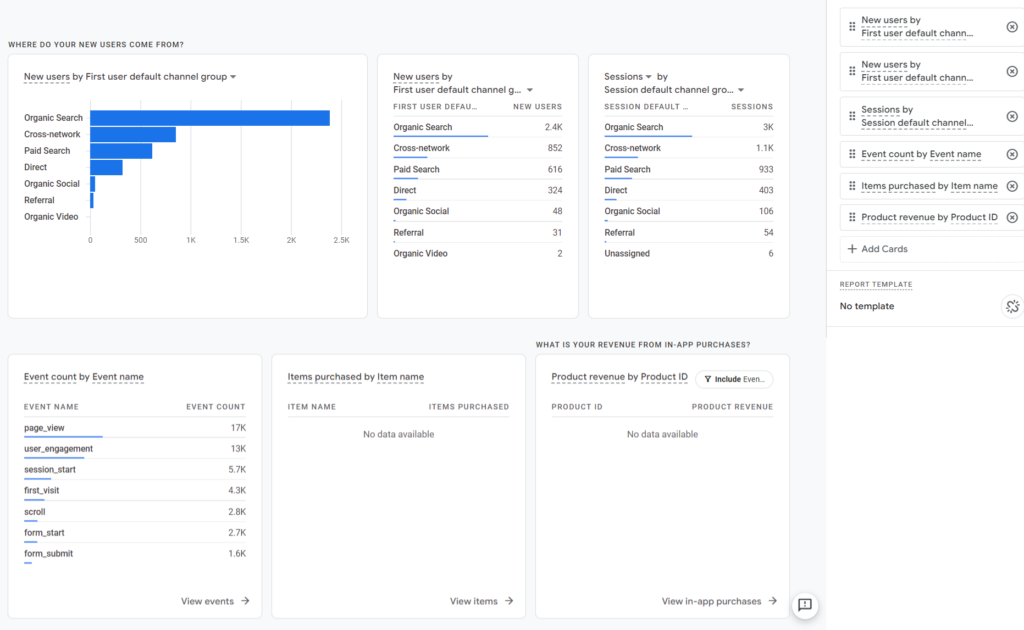
5. Creating Concise GA4 Summary Cards
Summary cards are concise information cards that are displayed in overview reports. These cards provide a summary of relevant details from one or more detail reports, including key dimensions and metrics.
To begin, navigate to the Library section and locate the “Create New Report” button. From the dropdown menu, select “Create Overview Report.” This action will open the interface where you can choose the specific cards that will be included in the Overview report.
The Overview report is essentially a compilation of these selected cards. These cards are generated when detailed reports are created, and they serve as condensed summaries of the information contained within those reports.
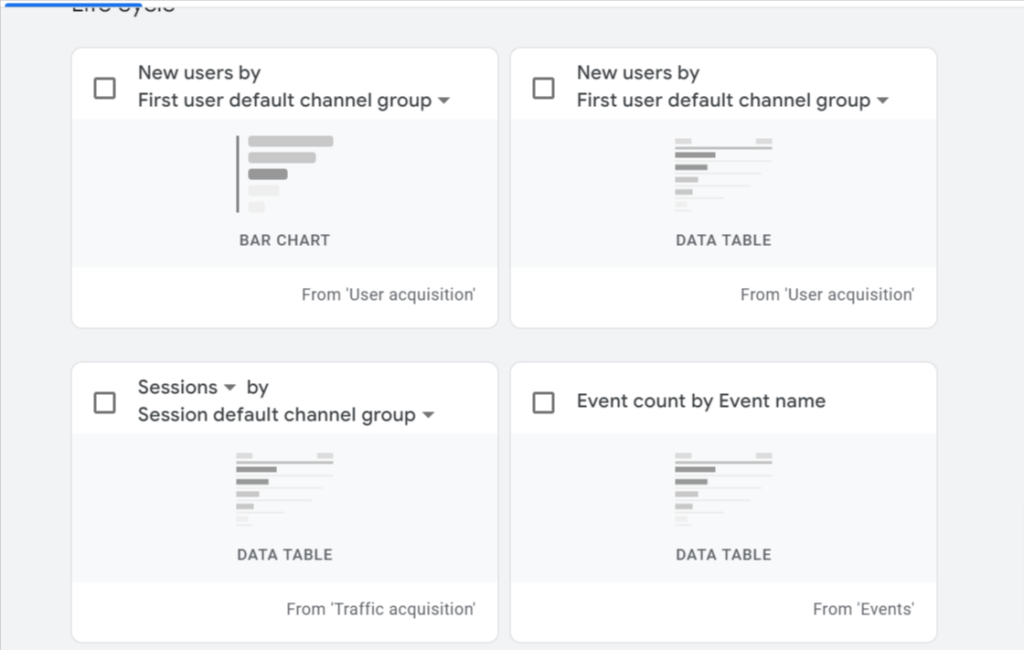
Once you’re done with adding all the relevant cards with metrics & dimensions, your dashboard will look something like this:
6. Managing Report Linkages in GA4
When a report is based on a report template, it will automatically receive updates whenever Google makes changes to that template. For instance, if Google introduces a new dimension to the User Acquisition report, that dimension will be reflected in all linked User Acquisition reports.
However, any modifications you or another administrator have made to the report will remain unaffected. This includes any dimensions, metrics, and visualizations that you or another property admin have added or removed.
If you prefer a report not to receive automatic updates, you can choose to unlink it. By default, reports created from scratch are already unlinked.
To unlink a report, simply access the report builder and click on “Unlink from the template.” Once the report changes are saved, unlinked objects cannot be linked to a template in the future.
Concluding Thoughts on GA4 Custom Reports
Right now it certainly feels like we can mold any data in the shape that we want, but everything has some limitations & GA4 custom reports are no exception. One of the most affecting limitations is that you can not export/import your custom templates to other accounts/properties. This means, if you have two different properties where you want to use the same customization, you will have to build both new reports from scratch.
If you are still facing any issues after migrating to GA4, you can check out this in-detail guide about migrating to Google Analytics 4 from Universal Analytics and you can even contact the Google Analytics Help Center.
FAQs
What Are the Benefits of Custom Reports in Google Analytics 4?
Custom reports in GA4 offer tailored insights by allowing you to personalize metrics, dimensions, and visualization, leading to more focused data analysis.
How Do I Start Creating a Custom Report in GA4?
Begin by choosing an existing detailed report or creating a new one, then customize metrics, dimensions, and charts as per your analytical needs.
Can I Export My GA4 Custom Report Templates to Other Accounts?
Currently, GA4 does not support exporting/importing custom report templates to other accounts or properties.
What Should I Do if I Face Issues After Migrating to GA4?
Refer to detailed guides and resources available online for troubleshooting and tips on migrating to GA4 effectively.
How Does Linking and Unlinking Reports in GA4 Work?
Linking a report to a template ensures it receives updates from Google, while unlinking it maintains its current state without future automatic updates.